Adam C Kellerman

and 11 more

Geomagnetically induced currents (GICs) at middle latitudes have received increased attention after reported power-grid disruptions due to geomagnetic disturbances. However, quantifying the risk to the electric power grid at middle latitudes is difficult without understanding how the GIC sensors respond to geomagnetic activity on a daily basis. Therefore, in this study the question “Do measured GICs have distinguishable and quantifiable long- and short-period characteristics?” is addressed. The study focuses on the long-term variability of measured GIC, and establishes the extent to which the variability relates to quiet-time geomagnetic activity. GIC quiet-day curves (QDCs) are computed from measured data for each GIC node, covering all four seasons, and then compared with the seasonal variability of Thermosphere-Ionosphere- Electrodynamics General Circulation Model (TIE-GCM)-simulated neutral wind and height-integrated current density. The results show strong evidence that the middle-latitude nodes routinely respond to the tidal-driven Sq variation, with a local time and seasonal dependence on the the direction of the ionospheric currents, which is specific to each node. The strong dependence of GICs on the Sq currents demonstrates that the GIC QDCs may be employed as a robust baseline from which to quantify the significance of GICs during geomagnetically active times and to isolate those variations to study independently. The QDC-based significance score computed in this study provides power utilities with a node-specific measure of the geomagnetic significance of a given GIC observation. Finally, this study shows that the power grid acts as a giant sensor that may detect ionospheric current systems.

Joseph Hughes

and 8 more

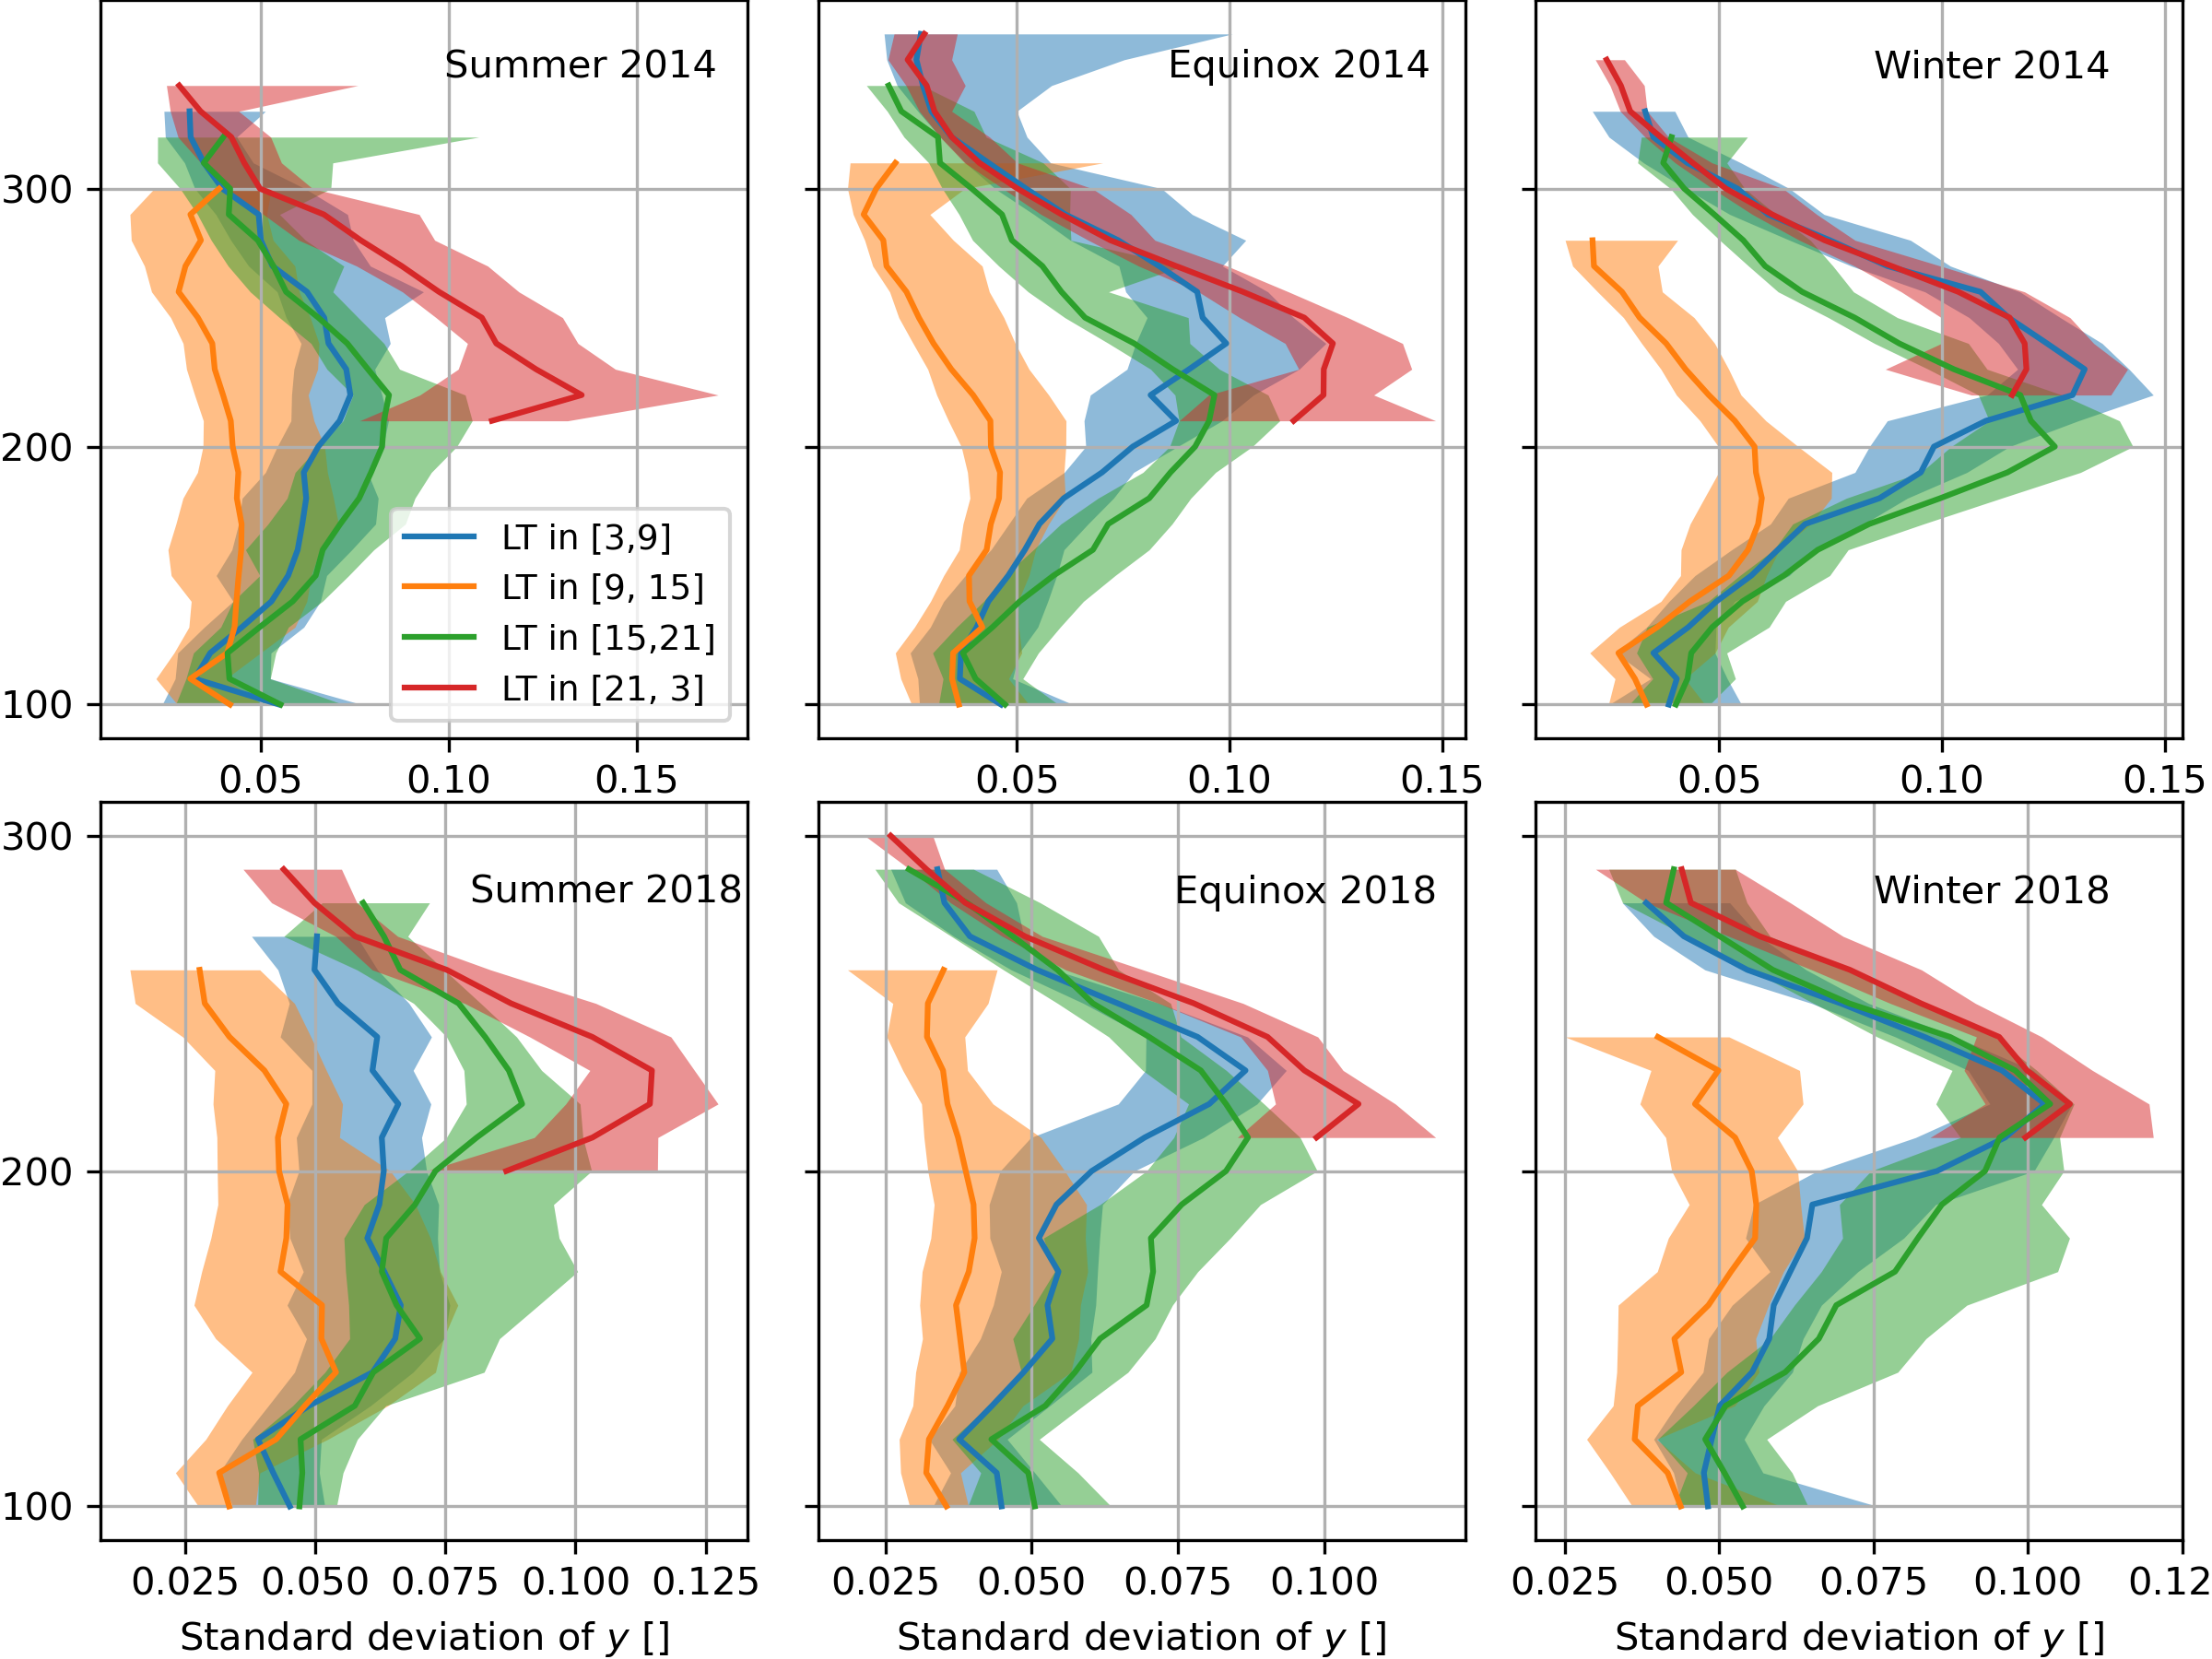
The ionosphere contains many small-scale electron density variations that are under represented in smooth physics-based or climatological models. This can negatively impact the results of Observation System Simulation Experiments, which use a truth model to simulate data. This paper addresses this problem by using ionosonde data to study ionospheric variability and build a new truth model with empirically-driven variations. The variations are studied for their amplitude, horizontal and vertical size, and temporal extent. Results are presented for different local times, seasons, and at two different points in the solar cycle. We find that these departures from a smooth background are often as large as 25\% and are most prevalent near 250 km in altitude. They have horizontal spatial extents that vary from a few hundred to a few thousand kilometers, and typically have the largest horizontal extent at high altitudes. Their vertical extents follow the same pattern of being larger at high altitudes, but they only vary from 10s of km up to 200 km in vertical size. Temporally, these variations can last for a few hours. The procedure for using these spatial and temporal distributions to add empirically-driven variance to a smooth truth model is outlined. This process is used to make a truth model with representative variations, which is compared to ionosonde data as well as GPS Total Electron Content (TEC) data that was not used to inform the model. The new model resembles the data much better than the smooth models traditionally used.

Joseph Hughes

and 9 more