Observations using Arecibo Observatory’s highly sensitive Incoherent Scattering Radar (AO-ISR) show ionospheric descending layers from as high as $\sim$400 km, much higher than earlier studies, with continuity down to 90 km. The AO-ISR was operated to observe the ion-line and plasma-line with coded-long-pulse for high temporal and spatial resolution of 35/10 seconds and 300 m, respectively, during 01-06 February 2019. We found multiple layering structures descending from 400 km to 90 km in all these six days. These layers are traditionally called intermediate descending layers (IDLs) ($>$130 km and below F-peak), upper semi-diurnal daytime $\&$ nighttime layers (110 km-130 km), and lower diurnal layers($<$110 km). We have denoted the new daytime descending layers above the hmF2 as top-side descending layers (TDLs). All these layers are collectively named ion descending layers (IonDLs) since all of them are connected with some discontinuity at the F1-peak (i.e., 170 km), except for the daytime lower-diurnal layer. The most pronounced IonDLs occur in the twilight times. IonDLs mainly occur in shear zones of the vertical ion drifts and are favored by downward ion drifts, and their descent speeds increase with increasing altitude. The estimated phase velocities of the waves in the F-region are comparable with the descending speed of the IonDLs. Furthermore, IonDLs/IDLs occur with and without spread-F events but intensified spread-F events raise their beginning altitude. The TDLs and IDLs are driven by gravity waves with time periods of 1.5-4 hours.
Upper atmospheric long-term trends could be examined in the ion temperatures ($T_i$) at the ionospheric F-region altitudes by the close coupling between neutrals and ions. We have analyzed the $T_i$ data sets of Arecibo Observatory (AO) incoherent scatter radar (18\textdegree20’N, 66\textdegree45’W) from 1985 to 2019, to examine the long-term trends of the ion temperature as a function of height from $\sim$140 km to $\sim$677 km. For this, the responses of $T_i$ to solar and geomagnetic activities have been taken into account as forcings of the $T_i$ behavior as well the annual and semi-annual oscillations. By removing the known forcing that govern the Ti behavior by the difference between the $T_i$ data and a climatological model, our results indicate that the upper atmosphere/ionosphere over Arecibo is cooling over the 35 years studied. Around 350 km, our findings also show that the rate of cooling over Arecibo is lower than previously reported for high latitudes, suggesting a latitudinal dependency. These cooling trends are believed to be the result of increasing green house gases, but the observed cooling trends exceed the magnitude of the cooling expected from green house gases. We have made an attempt to find the additional driver for observed cooling trends by linking the these upper atmospheric trends to lower atmospheric weather phenomena. We found that gravity waves in the lower atmosphere associated with terrestrial weather phenomena might be contributing to the observed cooling trends in the upper atmosphere.
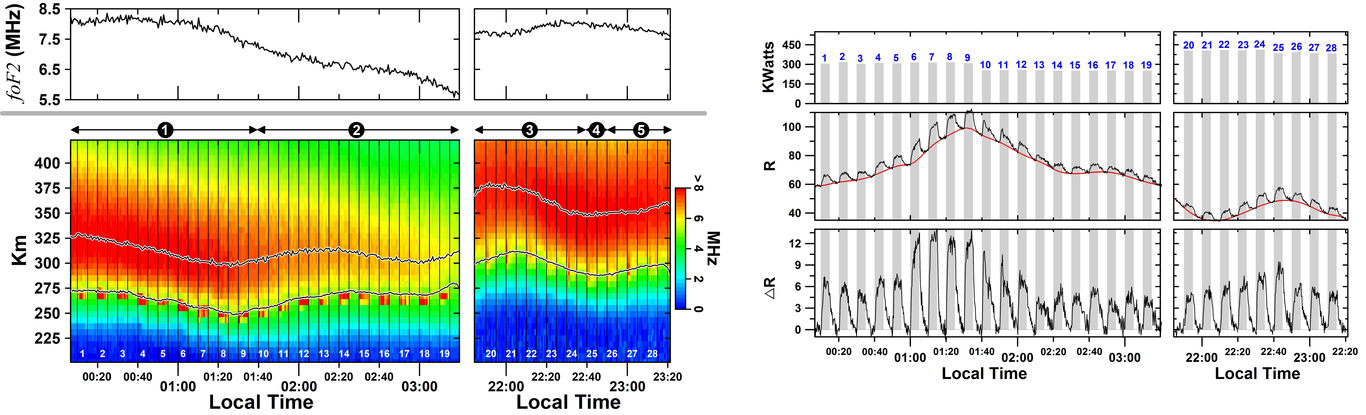
High frequency (HF) experiments inducing intensification of airglow emissions at 6300 Å; and 5577 Å (red and green lines, respectively) from the two lowest excited states of oxygen O(1D) and O(1S) has been studied since the early 1970s. The last generation Arecibo HF facility was commissioned in November 2015, and since then several campaigns have been conducted at AO. The current system consists of six transmitters, each connected to one of six dipole elements, and each capable of continuous wave (CW) operation at a nominal power of ~100 kW. Before the AO platform collapse on December 1, 2020, the HF transmitter system has two available frequencies, 5.125 MHz and 8.175 MHz, with 130 kHz and 100 kHz bandwidths, respectively. In this work we are analyzing the excitation of the red line airglow emission (3600 Å) by high-power radio waves at ~5.125MHz of 28 HF pulses of 5 minutes intercalated by 5 minutes of no HF interaction. The chosen periods were the pre-sunrise and post-sunset periods of June 5, 2016 (Figure 1). Coincidentally, a small geomagnetic storm occurred during these observations. The first experiment started along the initial phase of this disturbance and the second experiment at the end of the main phase (Figure 2). Up to now, our main findings are listed below: 1. Assuming that the modified red line comes from a narrow height range in the vicinity of the reflection height to a first approximation and considering that all of the excess emission comes from a single height (equation 1) (which corresponds to the height where the plasma frequency equals the transmitted frequency), it was detected that the lifetime of the O(1D) varies with altitude which a peak close to the red line emission altitudes (Figure 3). Θ_r=1/((T1+T2+T3+T4)) (1) Where T1 is the total Einstein transition probability of the O(1D) state, T2 is the N2 concentration at the altitude of reflection times its respective quenching coefficient (Q~5,0.10-11cm3s-1) as well as T3 the O2 concentration times its respective quenching coefficient (R~7,4.10-11cm3s-1). 2. Assuming a fixed lifetime for all altitudes, we detected variation of the N2 quenching coefficient O(1D) also varying with altitude. Such variation could be a miss determination of the N2 neutral concentration from the NRLMSISE-00 Atmosphere Model (Figure 4) (equation 1). 3. As a practical outcome, our study shows that the 5 minutes off is not sufficient for the excited region to return to the previous quiet condition. Our computations show that pulses of 3 minutes intercalated by 6 minutes off are the ones more appropriate (Figure 5).